How does the age structure of patients affect NHS payments to General Practice?

In 2023/24, 6,669 practices received £10.2 billion from the NHS. Capitation payments to individual practices are adjusted using the Carr-Hill formula. On average, practices received £164.64 per patient, with higher payments for practices serving older populations due to higher healthcare needs, prescribing costs and the specific needs of rural areas. This analysis explores how NHS payments to general practices are informed by the age structure, deprivation and rurality of registered patients.
There is variation in the proportion of older people across general practices. While the average proportion of patients aged 65+ is 18%, practices in the top quintile of older people have over 28% of patients aged 65+, while those in the bottom quintile have less than 8%.
Older patients tend to live in less deprived areas. For instance, among practices serving the most deprived quintile of patients, the average proportion of patients aged 65+ is 13.3%, compared to 21.5% among the practices in the most affluent quintile.
About 1,000 practices are in rural areas, of which about 40% serve in the most affluent quintile of patients. IMD is strongly associated with rurality (by definition: Living Environment = 9.3% of IMD composite): more than 98.5% of practices in the most deprived quintile are urban, compared to about half of the least deprived quintile. Older patients tend to live in less deprived areas, with rural practices showing lower average deprivation.
Association between Age Structure, Rurality, and the IMD
For 2023/24, information on the rurality of 6,669 practices is available from publicly available NHS Payments to General Practice data. Data on age structure of 6,395 of these practices are available from Fingertips. We split practices into quintiles, based on the proportion of patients aged 65+ years.
We then combine the age structure data for 2023 with the latest IMD data (2019) from Fingertips, extrapolated to 2023. IMD data was not available for 27 practices, because they are new since 2019, leaving 6,376 practices with information on deprivation, rurality, and age.
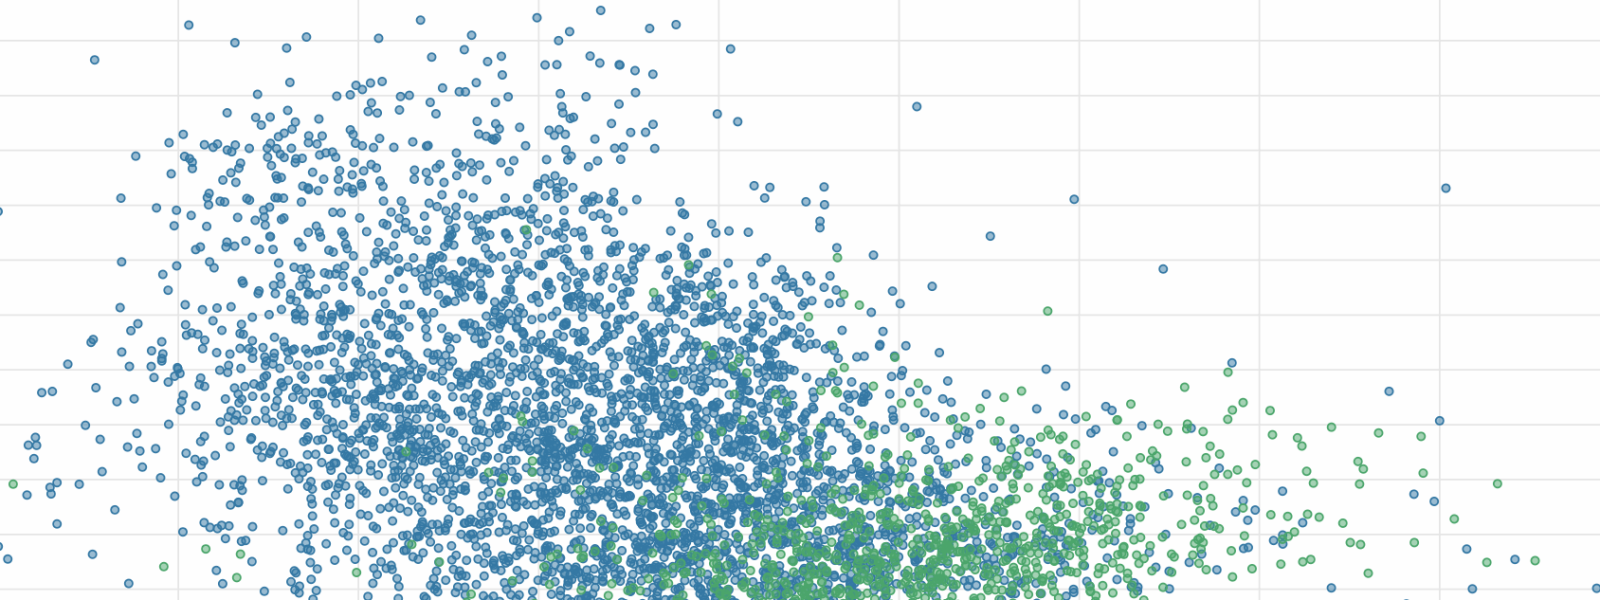
Plotting the proportion of patients aged 65+ for each practice against IMD reveals a cluster of rural practices in affluent areas with older patients. This clustering highlights how rurality and affluence influence patient demographics and funding.
|
Rurality (n) |
IMD (s.d.) |
Proportion of patients aged 65+, % (s.d.) |
Average payment per registered patient, £ (sd) |
|
Rural (1,064) |
15.1 (6.2) |
25.5 (5.5) |
232.63 (76.1) |
|
Urban (5,312) |
25.0 (11.8) |
16.4 (6.8) |
153.75 (33.8) |
|
All (6,376) |
23.4 (11.7) |
17.8 (7.4) |
164.64 (52.6) |
Why did practices with older populations receive more payments per patient?
Most practices received around £1.5 million: 20% of practices receive less than £720,000, and 20% receive over £2.2 million. Funding depends on the size of practices. The median number of registered patients served was 8,100: 20% of practices had fewer than 4,500 patients, whereas 20% had over 13,000. Each practice received an average £164.64 per patient. After removing practices with less than £0 in payments received and 0 registered patients, 20% of practices received less than £134 per patient, and 20% received over £189.
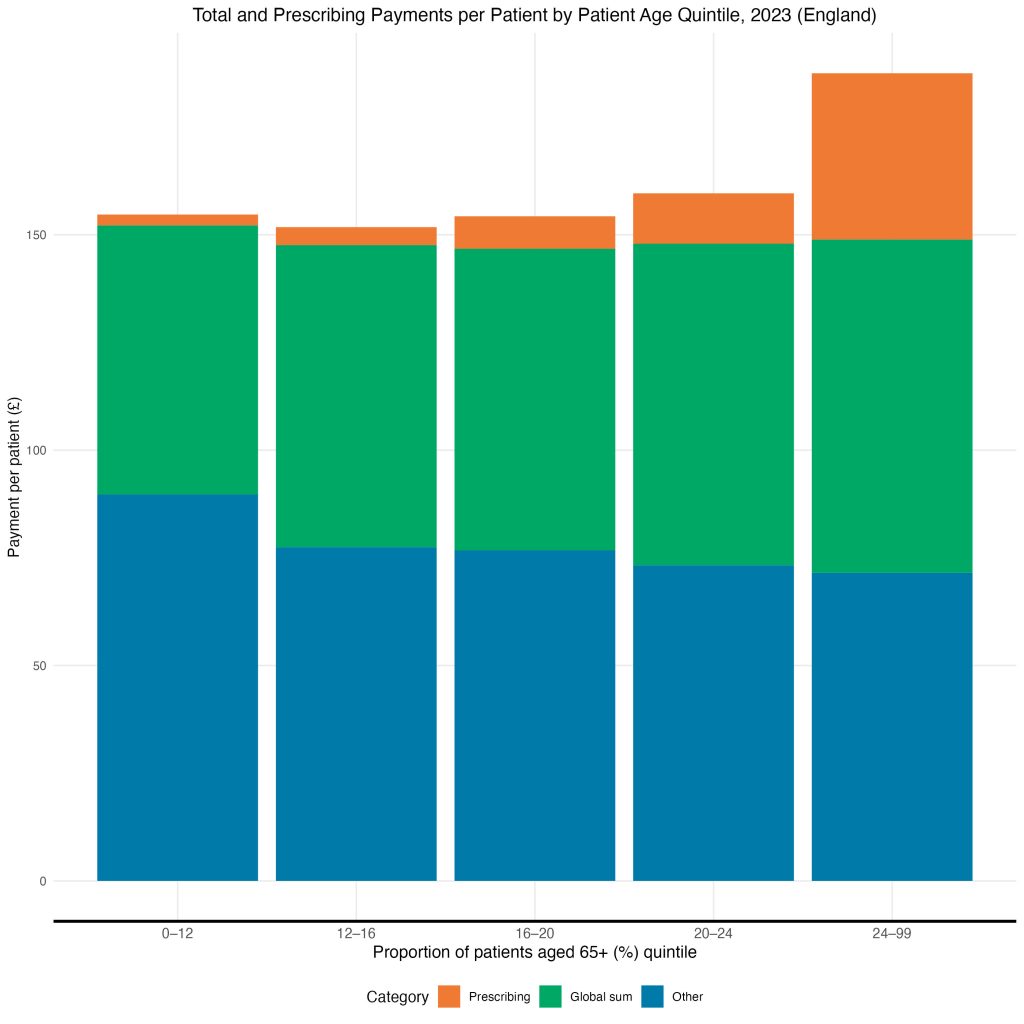
We plot the average total and prescribing payment per patient for all practices in each quintile of proportion of patients aged 65+. We see that 80% of practices receive about £152 per patient, while the 20% of practices with the largest proportion of patients aged 65+ received £206.

Prescribing Payments
This extra £54 is largely for prescribing payments, which account for ‘the specific costs of the NHS dispensing GP service’. The NHS spent £869m on prescribing payments to General Practices in 2023 (less than 10% of total payments): £576m, or 66%, were to the 20% of practices with the largest proportion of patients aged 65+. About 20% of payments per patient are prescribing for practices with the oldest population.
Global Sum
Global Sum payments are capitation payments and constitute the largest payments to General Practice. Practices receive a certain amount per patient based according to the Carr Hill formula, which calculates patients’ healthcare need based on factors such as the age and sex of patients, the presence of patients in nursing or residential care, additional healthcare needs due to medical conditions, patient turnover, and unavoidable costs related to rurality and staff market forces in the area.
Healthcare need is strongly associated with age and so practices with older populations receive more Global sum payments to account for more complex healthcare needs, such as more home visits.
Association between Deprivation and Payments
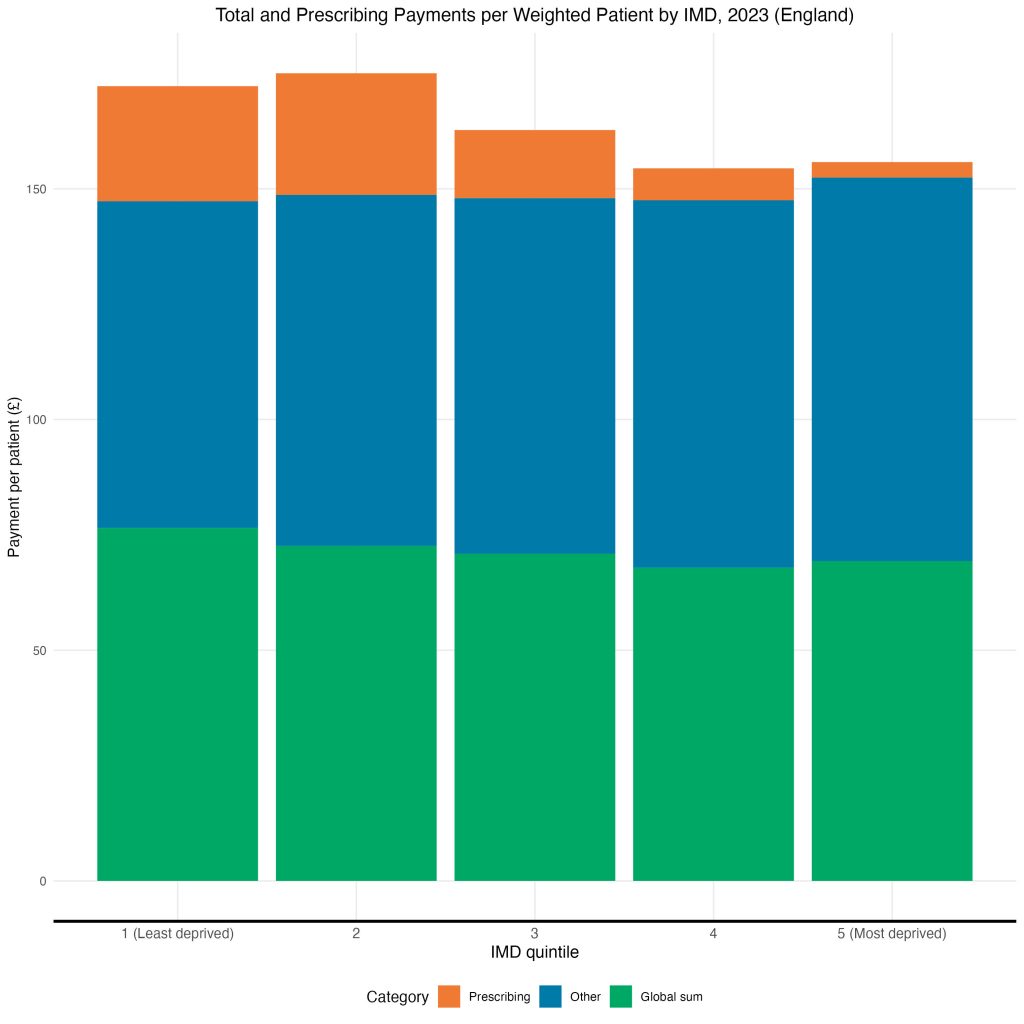
The average total, prescribing, and global sum payments per patient for all practices in each IMD quintile reveal a socioeconomic gradient, whereby practices in the most affluent areas receive more Global Sum and Prescribing payments than practices in more deprived areas. It would appear that this disparity can largely be explained by Dispensing practices in affluent areas serving an older population.

Nonetheless, a socioeconomic gradient in Patient Experience of General Practice still exists. Perhaps, then, the Global Sum formula does not sufficiently account for deprivation in its estimation of healthcare need, nor does it compensate for the loss of Prescribing revenue for practices in deprived areas.
