Dispensing Practices, NHS Funding, and the Geography of Inequality
In 2023, 6,669 general practices received £10.2 billion in NHS funding across England, increasing to £11 billion with COVID-related and Primary Care Network (PCN) payments. Almost 10% of this—£870 million—was allocated to prescribing- and dispensing-related payments, supporting 944 dispensing practices serving 9.5 million patients (£625 million) and 5,537 non-dispensing practices covering 53 million patients (£245 million).
The Role of Dispensing Practices
Dispensing practices differ from standard GP surgeries by directly providing medications to eligible patients, improving access in rural areas where pharmacies are scarce. This integration streamlines care and reduces the burden on external pharmacies. Delivering these additional services comes with associated costs that non-dispensing practices do not incur.
NHS regulations restrict which practices can dispense and which patients are eligible:
- Practice Eligibility: Since March 2005, GP practices can only apply for dispensing status if they are located in a controlled locality and more than 1.6 km from the nearest pharmacy. Due to the extensive pharmacy network in England, very few new dispensing practices have been approved since then.
- Patient Eligibility: Patients must reside in a controlled locality and have a registered address at least 1.6 km from the nearest pharmacy to qualify for dispensing services. Approximately 3.5 million patients meet these criteria, accounting for about 7% of all prescription items dispensed in England.
These regulations primarily limit dispensing practices to rural areas and influence funding distribution.
Dispensing Practices Receive More Funding Per Patient
For 2023, information on the dispensing status of practices is available from publicly available NHS Payments to General Practice data. We combined the payments data with practice-level estimates of relative deprivation from the Office of Health Improvements and Disparities, extrapolated to 2025.
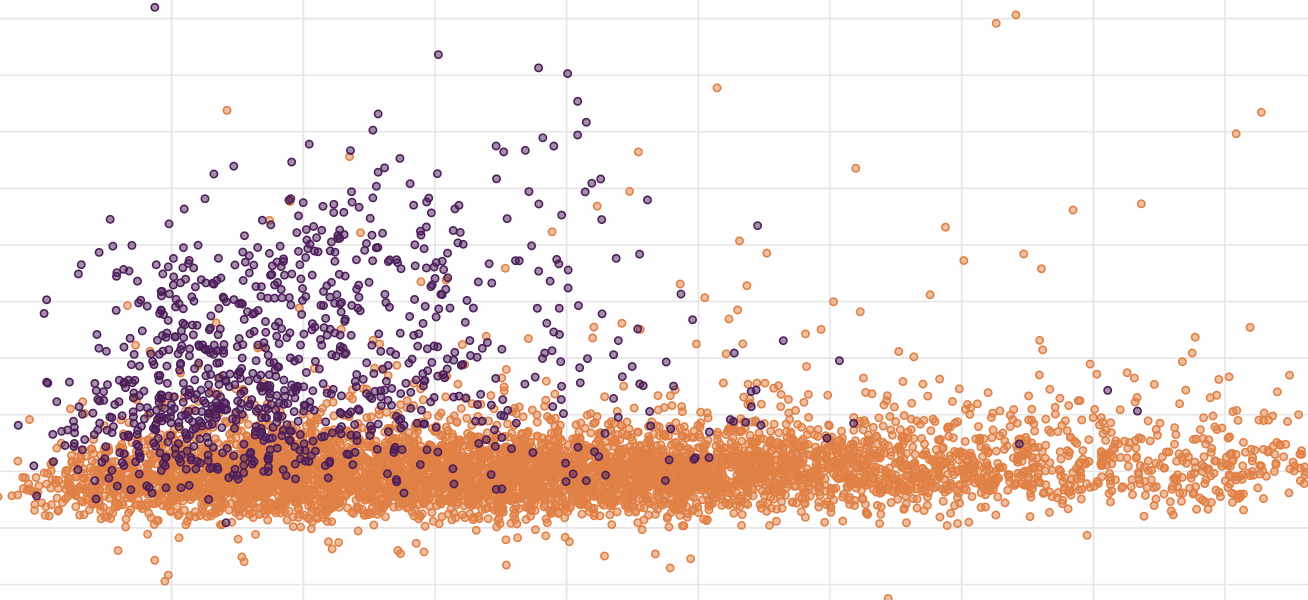
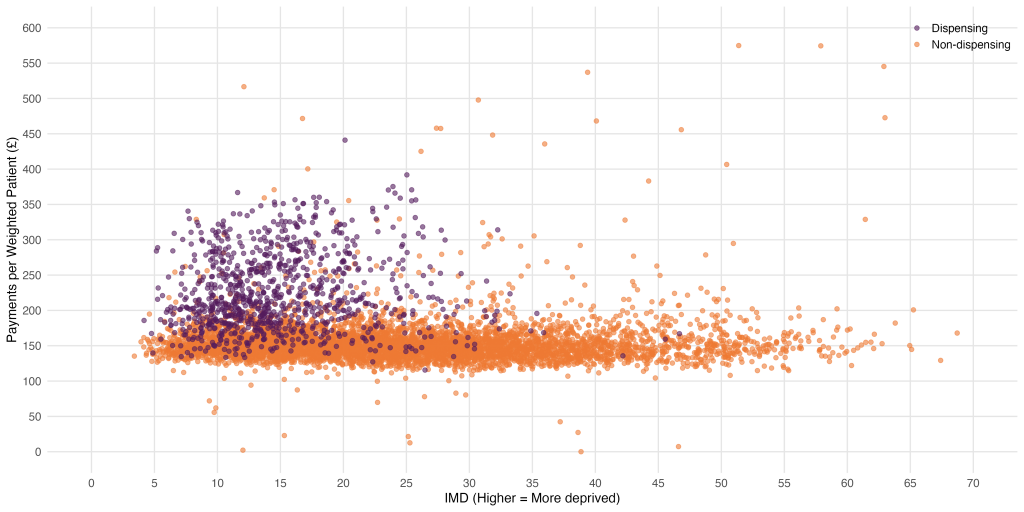
A scatter plot of IMD vs. Payments per Registered Patient by dispensing status reveals two distinct clusters of practices, showing that practices serving populations in wealthier areas are more likely to dispense, and consequently receive more funding:
- A horizontal band of non-dispensing practices—serving patients from a wide range of socioeconomic backgrounds—with an average of £153.26 per weighted patient.
- A vertical cluster of dispensing practices, which tend to serve patients in more affluent areas (mean IMD 15.1 compared to 24.8 for non-dispensing practice), and receive almost £100 more per registered patient.
Deprivation, IMD vs. Payment per registered patient, £
| Dispensing status (n) | Average IMD (s.d.) | Average payments per registered patient, £ (s.d.) |
| Dispensing (944) | 15.1 (5.9) | 247.25 (72.56) |
| Non-dispensing (5,537) | 24.8 (11.8) | 153.26 (33.15) |
| All (6,669) | 23.3 (11.6) | 167.08 (53.12) |
- Data sources: NHS Payments to General Practice and OHID; collated by HEEC
- Excluded practices with unknown dispensing status or IMD, and 0 patients or payments
- Unweighted mean of practice-level ‘Average payments per registered patient’ by Dispensing type
The Costs of Dispensing in General Practice
Prescribing and dispensing-related services require additional financial and operational investments, which non-dispensing GP surgeries do not incur. While some prescribing and dispensing-related costs are directly reimbursed, others are absorbed as operational losses, limiting overall profitability. Examples include:
Direct Costs of Dispensing
- Drug Procurement: Dispensing practices negotiate drug prices with pharmaceutical companies, often at a disadvantage compared to large pharmacy chains.
- Stock and Inventory Management: Managing opening and closing stock levels, ensuring adequate supply while minimising waste.
- Reimbursement Adjustments: The NHS limits how much of the purchasing discount practices can retain.
Operational and Staffing Costs
- Dispensing Staff Salaries: These costs are only partially covered by NHS dispensing fees.
- Regulatory Compliance: Additional administrative burdens, including controlled substance documentation and audits.
- Dispensing Environment: Secure storage, temperature control, heating, electricity, and IT infrastructure for prescription management.
Economies of Scale and Competition
- Unlike community pharmacies and hospital dispensaries, GP dispensing practices operate on a much smaller scale: about 60% of community pharmacies were run by contractors operating six or more pharmacies (for example, large corporate pharmacy chains).
- Individual GP practices have far less bargaining power with pharmaceutical companies and can pay higher prices for medications.
- Community pharmacies offer additional services (vaccinations, minor ailments schemes, home delivery services), which may draw patients away from dispensing GP practices.
Adjusting for Healthcare Need and Rurality
Dispensing practices predominantly serve older populations with higher chronic disease prevalence. Thus, comparing payments per weighted patient rather than registered patient represents a fairer assessment. We weighted payments based on the Carr-Hill index, which accounts for age, sex, nursing/residential care, medical conditions, mortality, patient turnover, and rurality-related costs. When the number of patients were weighted for need, the disparity in payments was £72 per weighted patient.
Deprivation, IMD vs. Payment per weighted patient, £
| Dispensing status (n) | Average IMD (s.d.) | Average payments per weighted patient, £ (s.d.) |
| Dispensing (944) | 15.1 (5.9) | 225.53 (54.44) |
| Non-dispensing (5,537) | 24.8 (11.8) | 153.76 (32.27) |
| All (6,669) | 23.3 (11.6) | 164.33 (44.40) |
- Data sources: NHS Payments to General Practice and OHID; collated by HEEC
- Excluded practices with unknown dispensing status or IMD, and 0 patients or payments
- Unweighted mean of practice-level ‘Average payments per weighted patient’ by Dispensing type
Adjusting for Prescribing- and Dispensing-related Payments
Since dispensing practices function as both GP surgeries and community pharmacies, a direct funding comparison with non-dispensing practices is misleading. Prescribing- and dispensing-related payments are described as follows:
Reimbursement of Drugs Payments
- These payments cover the cost of drugs dispensed by GP practices or pharmacies.
- Reimbursement is based on:
- The Drug Tariff for commonly used generics.
- The NHS List Price for branded medications.
- The net purchase price when neither of the above applies.
- The NHS adjusts these reimbursement rates regularly to reflect market conditions, but practices do not always retain the full benefit of purchasing discounts due to NHS reimbursement adjustments.
Dispensing Fee Payments
- Dispensing fees are NHS payments made to cover the act of preparing and distributing prescriptions.
- Payments are calculated per prescription item, with economies of scale leading to lower per-item fees for high-volume dispensers.
- As of October 2024, the average dispensing fee per item was £2.18, meaning that smaller-volume dispensing practices earn proportionally less from these payments.
Prescribing Fee Payments
- Negative for dispensing practices (-£26.5 million) but positive for non-dispensing practices (£35 million).
| Dispensing status (n) | Reimbursement of Drugs, £ million | Dispensing Fee, £ million | Prescribing Fee, £ million | Total, £ million |
| Dispensing (944) | 480 | 171 | -27 | 625 |
| Non-dispensing (5,537) | 210 | 0.5 | 35 | 245 |
| All (6,669) | 690 | 172 | 8 | 870 |
- Data sources: NHS Payments to General Practice
- Excluded practices with unknown dispensing status
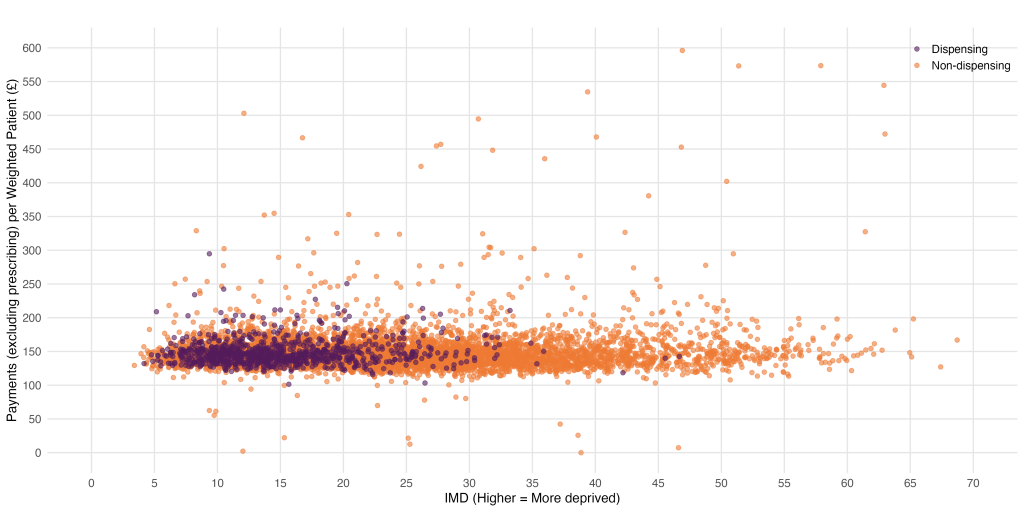
Deprivation, IMD vs. Payments (excluding dispensing and prescribing) per weighted patient, £
The disparity in funding disappears when prescribing and dispensing-related payments are removed.
| Dispensing status (n) | Average IMD (s.d.) | Average payments (excluding dispensing and prescribing) per weighted patient, £ (s.d.) |
| Dispensing (944) | 15.1 (5.9) | 147.98 (17.83) |
| Non-dispensing (5,537) | 24.8 (11.8) | 149.30 (33.40) |
| All (6,669) | 23.3 (11.6) | 149.10 (30.33) |
- Data sources: NHS Payments to General Practice and OHID; collated by HEEC
- Excluded practices with unknown dispensing status or IMD, and 0 patients or payments
- Unweighted mean of practice-level ‘Average payments per registered patient’ (after removing prescribing- and dispensing-related payments) by Dispensing type
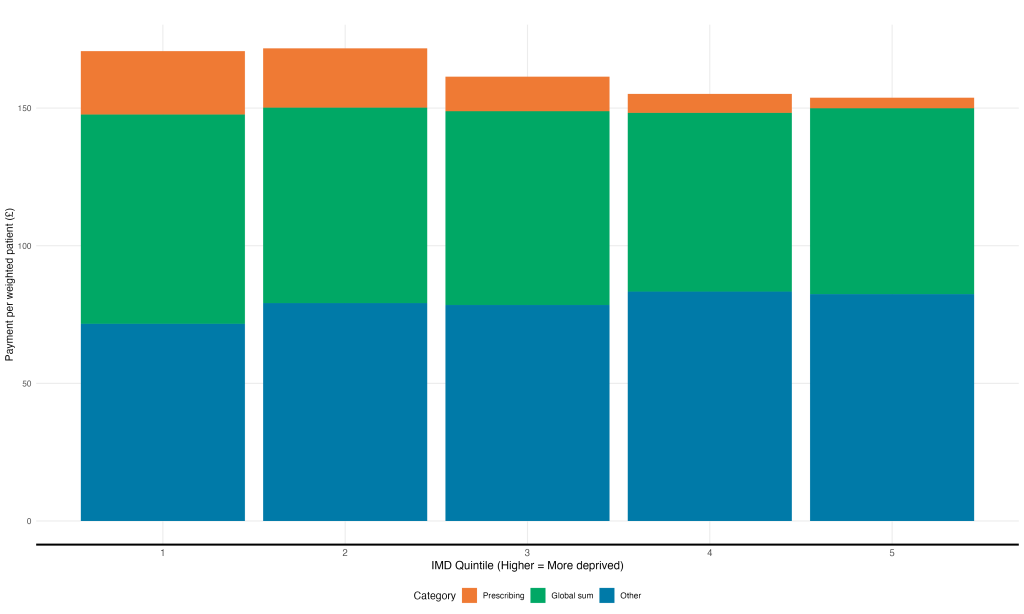
Total Payments by Type per Weighted Patient by IMD Quintile
The following bar chart comparing total vs. prescribing payments across IMD quintiles confirms:
- There are higher prescribing and dispensing-related payments in more affluent areas, which is likely driven by the concentration of dispensing practices and eligible patients in these areas.
- After controlling for healthcare need and dispensing services, the disparity in payments disappears.
- Data sources: NHS Payments to General Practice and OHID; collated by HEEC
- Excluded practices with unknown IMD and 0 patients or payments
Workforce, Patient Satisfaction and Earnings in Dispensing Practices
The following summary presents descriptive comparisons between dispensing and non-dispensing practices across workforce size, patient satisfaction, and earnings. Please note that these trends are observational and should not be interpreted as causal relationships: we have not conducted statistical analyses to account for potential confounding factors or underlying differences between the two types of practices.
Workforce Density by Dispensing Status
Dispensing practices tend to have larger workforces relative to patient list size and healthcare need.
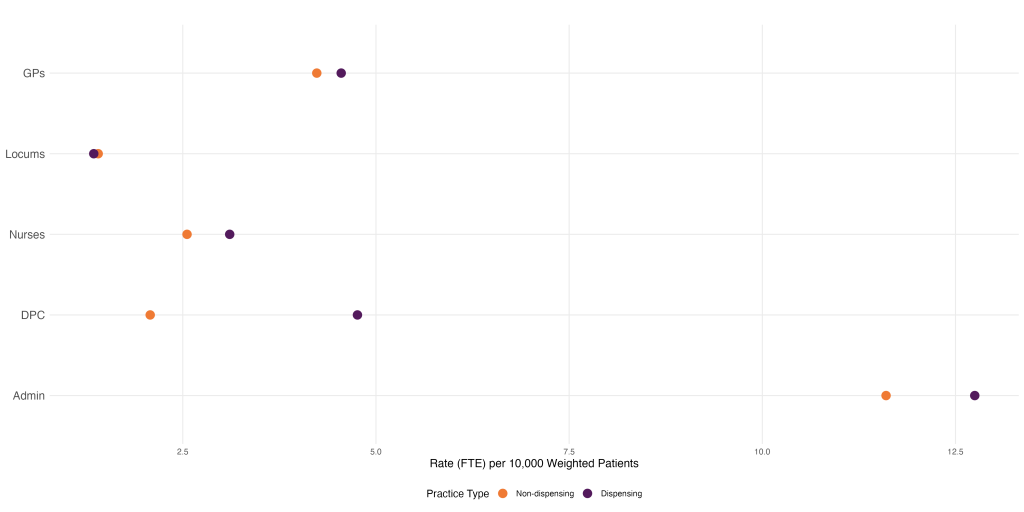
- Data Source: General Practice Workforce
Patient Satisfaction by Dispensing Status
Dispensing practices consistently performed better when patients were asked about their Overall satisfaction, Experience of contacting the surgery, Continuity of care and Confidence and trust.
| Dispensing Status (n) | Overall, % | Continuity, % | Access, % | Trust, % |
| Dispensing (944) | 79.2 | 42.6 | 64.3 | 95.4 |
| Non-dispensing (5,537) | 71.6 | 35.2 | 53.5 | 92.3 |
| All (6,669) | 72.7 | 36.2 | 55.0 | 92.7 |
- Data Source: GP Patient Survey
GP Partner Income (before tax) by Dispensing Status
GP partners at dispensing practices earn £12,200 more per year before tax than non-dispensing counterparts.
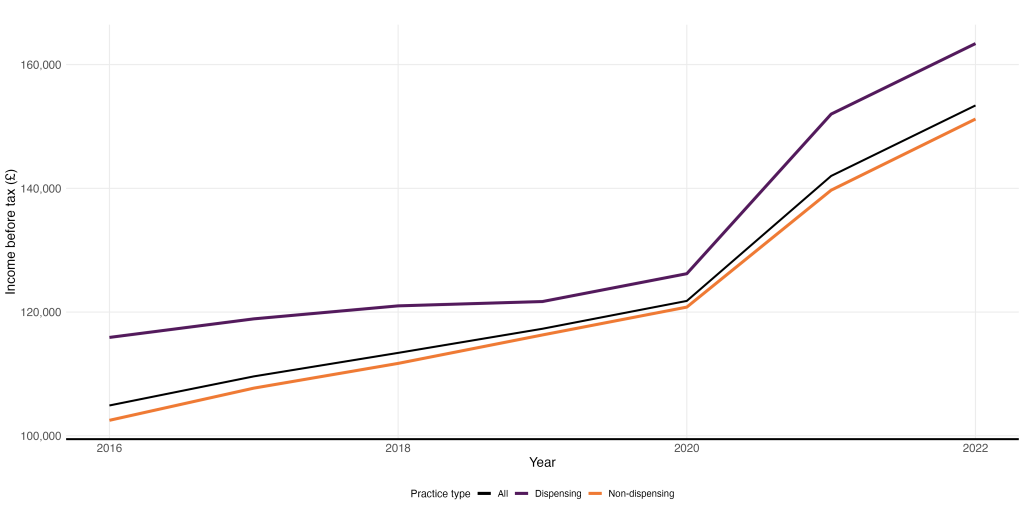
- Data Source: GP Earnings and Expenses Estimates
Final Thoughts: Reforming NHS Funding to Reflect Patient Need
It is well documented that practices in deprived areas receive less funding than practices in more affluent areas. However, the general practice funding model is complex, with multiple income streams depending on the services provided. Understanding the costs to provide these additional services compared to the income received for them is difficult (if not impossible given the lack of available data). This article highlights some of this complexity, illustrating how the distribution of dispensing practices results in more funding for practices in more affluent areas, as compensation for providing an additional service when compared to non-dispensing practices. Making general practice funding more sustainable and equitable therefore requires a holistic approach across all funding streams: there is no single solution.
Importantly, any funding and contractual reforms should focus on allocating resources proportionate to need, rather than simply existing workload. Current funding mechanisms, such as the Carr-Hill formula, primarily reimburse practices based on retrospective measures of workload—factors like patient demographics and historical service use. However, these formulas often fail to account for the additional challenges faced by practices serving areas with greater health needs. A more equitable approach would explicitly integrate measures of deprivation and healthcare inequity into funding calculations, ensuring that resources are distributed in a way that enables practices to meet the needs of their communities, rather than merely sustaining existing service patterns.