Exploring the impact of dispensing practices on equity in NHS payments to general practices
General practices serving the most deprived populations receive less funding per weighted patient than those serving the least deprived. Here we show that this inequality is driven by a higher concentration of dispensing practices in more affluent areas.
Across all practices, those in the least deprived 20% received £182 per weighted patient in 2023, compared to £166 for those in the most deprived 20% – a gap of £16. When we exclude all dispensing practices from this analysis, the gap is only £1. The gap in payments to dispensing practices is much larger (£32), but this is partly because there are only 6 dispensing practices covering the most deprived 20%.
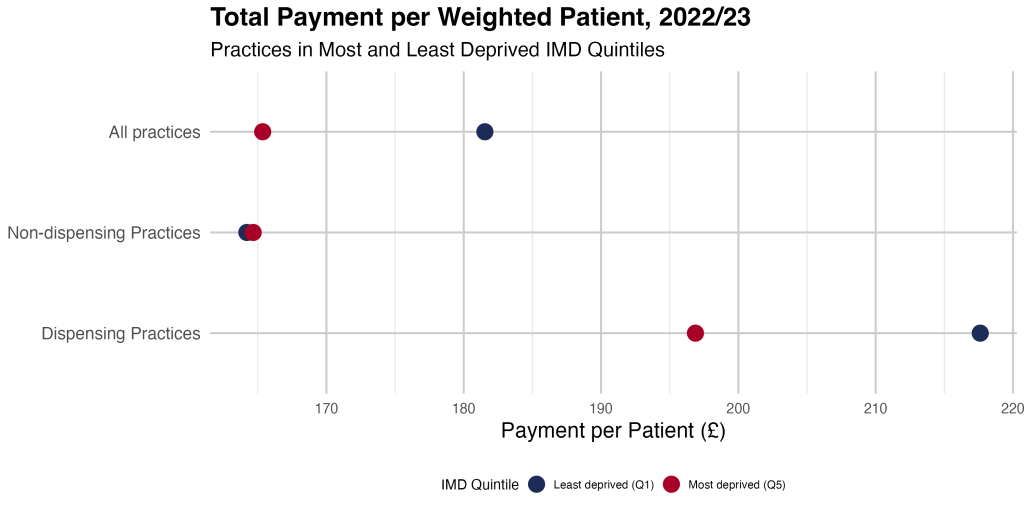
- Sum of all payments divided by the sum of all patients, by practice type and IMD quintile
What are dispensing practices?
Dispensing practices are practices where “at the patient’s request dispensing doctors are allowed to dispense the medicines they prescribe for these patients” (DDA); they are not the same as practices with an on-site pharmacy.
In 2023, there were 944 dispensing covering 9,505,878 patients and 5,537 non-dispensing practices covering 52,628,766 patients in England (dispensing status unknown for 188 practices).
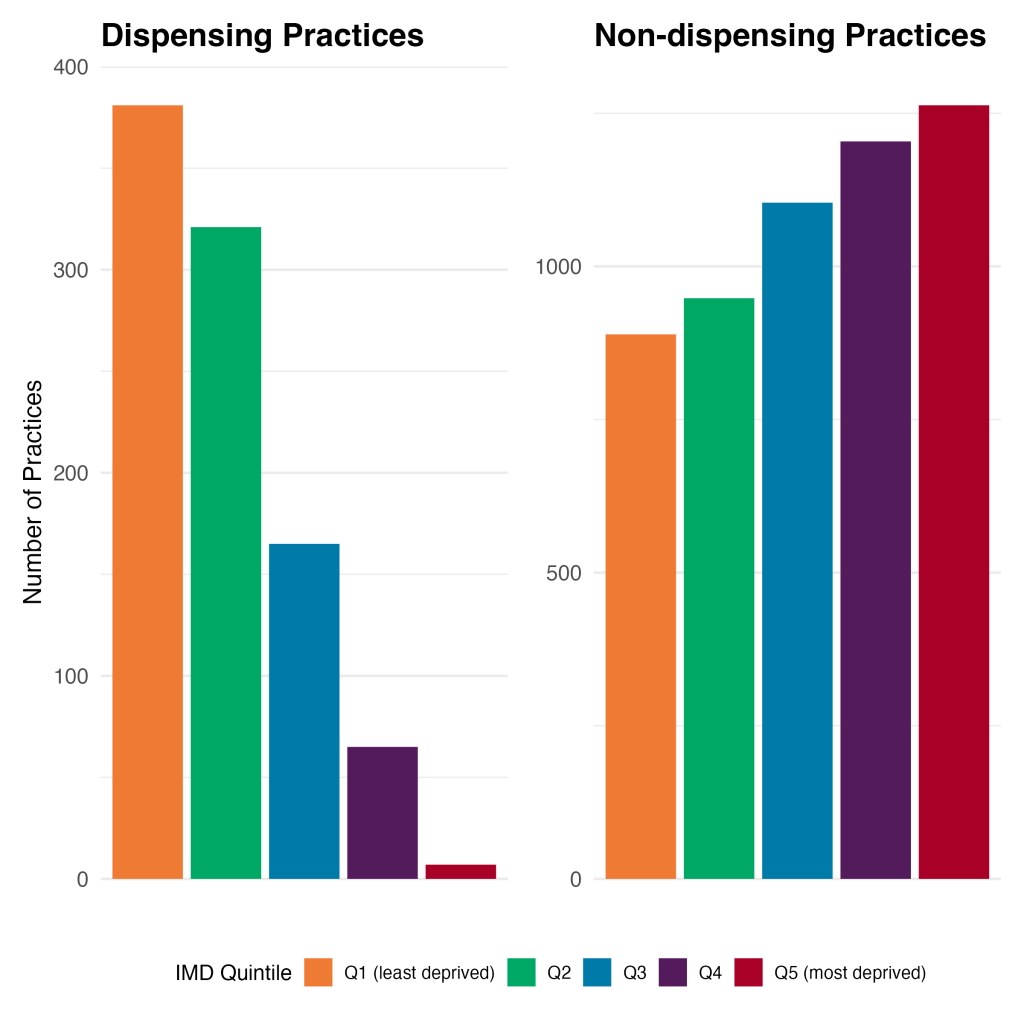
73% of all dispensing practices are in rural areas. One explanation for this unequal geographical distribution is that in order for a dispensing practice to dispense medicine, “the patient must live more than 1.6km from a retail pharmacy or the area must be designated as a ‘reserved location'” (DDE). Therefore, dispensing practices are only likely to dispense enough medicine to be sufficiently profitable in rural areas.
Consequently, dispensing practices tend to be in more affluent areas: 42% of dispensing practices serve patients in the least deprived quintile and 33% serve those in the second least deprived quintile, whereas about 1% cover the most deprived quintile.
How do payments differ between dispensing and non-dispensing practices?
Dispensing and non-dispensing practices receive reimbursement for the drugs they use. For dispensing practices, prescribing payments constitute 27.5% of total payments for dispensing practices, but only 2.84% for non-dispensing practices.
| Prescribing total | Total payments received | % Total | |
| All dispensing practices | £624,136,108 | £2,268,785,305 | 27.5 |
| All non-dispensing practices | £244,166,199 | £8,589,930,080 | 2.84 |
As result, prescribing fees constituted a larger percentage of total payments for more affluent practices (13%) than less affluent ones (2%) in 2023. Excluding prescribing payments from the total reduces the difference in total payments between practices covering the most and least deprived quintiles from £636 million to £371 million (or from a ratio of 1.36 to 1.21).
Total payments by type by IMD quintile, 2023 (England)
Are there differences in patient outcomes or GP salaries?
In 2023, 79.2% of patients described their overall experience with dispensing practices as ‘Good’ versus 71.6% of patients of non-dispensing practices. We do not know how much is because the practice dispenses, which is more convenient for patients, and how much of this a general pattern that practices in more affluent areas tend to have higher patient satisfaction (see more here).
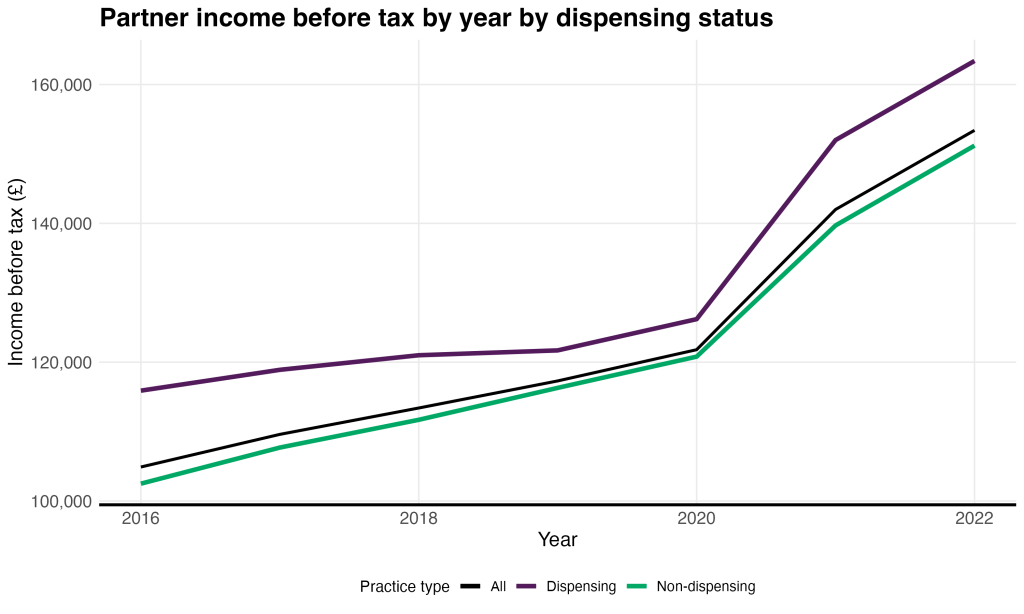
In terms of salaries, in 2022, the average income before tax for partners of dispensing practices was £163,400, versus £151,200 for non-dispensing partners, according to the GP Earnings and Expenses estimates.
Does the number of dispensing practices vary by ICB?
Some ICBs have far more dispensing practices than others, and subsequently receive more of their total payments from prescribing.
Lincolnshire ICB has the largest proportion of practices that are dispensing, with 55 out of 85 (65%). Conversely, metropolitan ICBs – such as those in London, Birmingham and Manchester – have 0 dispensing practices.
In this analysis we demonstrate the impact that dispensing practices have upon the inequality that exists in general practice funding. It is critical that policy makers take this into account when considering how to address this inequality, and how to make future general practice funding more equitable.
|
ICB Name |
Number of practices |
Number of dispensing practices |
Practices that are dispensing (% total) |
Prescribing payments / Total payments (%) |
Average payment per patient (£) |
|
Lincolnshire |
85 |
55 |
65 |
27 |
212 |
|
Cornwall and the Isles of Scilly |
57 |
36 |
63 |
21 |
221 |
|
Norfolk and Waveney |
106 |
61 |
58 |
22 |
246 |
|
Suffolk and North East Essex |
93 |
50 |
54 |
18 |
189 |
|
Cambridgeshire and Peterborough |
88 |
41 |
47 |
14 |
203 |
|
Humber and North Yorkshire |
186 |
75 |
40 |
16 |
195 |
|
Herefordshire and Worcestershire |
80 |
31 |
39 |
20 |
184 |
|
Gloucestershire |
74 |
28 |
38 |
12 |
202 |
|
Shropshire, Telford and Wrekin |
51 |
18 |
35 |
15 |
203 |
|
Somerset |
64 |
20 |
31 |
13 |
194 |
|
Northamptonshire |
71 |
22 |
31 |
11 |
202 |
|
Bath and North East Somerset, Swindon and Wiltshire |
91 |
28 |
31 |
13 |
170 |
|
Buckinghamshire, Oxfordshire and Berkshire West |
163 |
44 |
27 |
12 |
153 |
|
Devon |
123 |
31 |
25 |
11 |
197 |
|
Kent and Medway |
203 |
50 |
25 |
10 |
203 |
|
Dorset |
80 |
17 |
21 |
11 |
191 |
|
Bedfordshire, Luton and Milton Keynes |
99 |
20 |
20 |
7 |
192 |
|
Coventry and Warwickshire |
120 |
23 |
19 |
11 |
185 |
|
Staffordshire and Stoke-on-Trent |
146 |
26 |
18 |
8 |
166 |
|
Mid and South Essex |
152 |
27 |
18 |
8 |
170 |
|
Sussex |
171 |
28 |
16 |
9 |
186 |
|
Derby and Derbyshire |
118 |
17 |
14 |
7 |
180 |
|
Leicester, Leicestershire and Rutland |
134 |
19 |
14 |
8 |
174 |
|
Hampshire and Isle of Wight |
157 |
22 |
14 |
7 |
161 |
|
North East and North Cumbria |
367 |
50 |
14 |
6 |
167 |
|
Hertfordshire and West Essex |
142 |
18 |
13 |
7 |
155 |
|
Lancashire and South Cumbria |
205 |
20 |
10 |
6 |
169 |
|
Nottingham and Nottinghamshire |
135 |
13 |
10 |
7 |
173 |
|
Surrey Heartlands |
104 |
9 |
9 |
7 |
171 |
|
Frimley |
78 |
5 |
6 |
4 |
187 |
|
South Yorkshire |
178 |
11 |
6 |
4 |
156 |
|
Bristol, North Somerset and South Gloucestershire |
80 |
4 |
5 |
5 |
162 |
|
West Yorkshire |
282 |
12 |
4 |
4 |
184 |
|
Cheshire and Merseyside |
367 |
12 |
3 |
4 |
173 |
|
Black Country |
190 |
1 |
1 |
3 |
155 |
|
Birmingham and Solihull |
195 |
0 |
0 |
2 |
181 |
|
Greater Manchester |
426 |
0 |
0 |
2 |
164 |
|
North Central London |
192 |
0 |
0 |
1 |
160 |
|
North East London |
281 |
0 |
0 |
1 |
171 |
|
North West London |
351 |
0 |
0 |
2 |
163 |
|
South East London |
202 |
0 |
0 |
2 |
172 |
|
South West London |
182 |
0 |
0 |
3 |
154 |